1) Getting Started with the Best Beans App:
Login Page:
– Upon launching the application, users are presented with the Login Page. If they already have an account, users are able to log in to their account by providing the requested information (email address, password) and pressing the ‘Login’ button to proceed to the Overview page. If the user provides incorrect information when logging in, an error message will appear and prompt the user to try again.

Login Page for Android

Login Page for iPhone
Create a New Account or Join an Existing Farm:
– To create an account, users must press the “Sign Up” button to get started. They are then directed to the Create or Join page where they have the option to create a new farm or join an existing farm as a user.
Create a new farm:
– When a user chooses the option to “Create a New Farm”, they are directed to the “Sign Up” page, where they can enter the requested information (First Name, Last Name, Email, Password, Re-Enter Password). Users can press the “Create Account” button when the form is complete to proceed to the verification step. Users will be directed to check their email for a 6-digit verification code from Best Beans. Once users enter their verification code and press the “Verify” button, they will be directed to the ‘Farm Registration’ page if the verification code is valid. If the verification is invalid, the user will be prompted to re-enter the verification code again.

Create a New Farm Android

Create a New Farm iPhone
Join an Existing Farm:
– When a user chooses the option “Join Existing Farm”, they will be prompted to enter the farm code of an existing farm within Best Beans. The account that initially set the farm up is known as an ‘Admin’ and is the only one that has access to the Farm Code for their farm. Therefore, when users join an existing farm, they will be limited to certain functionalities compared to an admin.
- If the user provides the correct information in the form for the Farm Code, they will be directed to the “Sign Up” page where they can enter the requested information (First Name, Last Name, Email, Password, Re-Enter Password). Users can press the “Create Account” button when the form is complete to proceed to the verification step.
- Users will be directed to check their email for a 6-digit verification code from Best Beans. Once they enter their verification code and press the “Verify” button, they will be directed to the ‘Welcome’ page if the verification code is valid. On the ‘Welcome’ page, the user will be asked to log in to their account after successfully completing the ‘Join Existing Farm’ process.

Join Existing Farm Android

Join Existing Farm iPhone


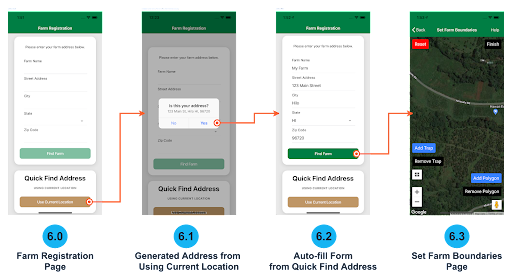
Farm Registration:
– On the “Farm Registration” page, the form requests a farm name and a physical address. Best Beans uses the address provided to locate and center the user’s farm on Google Maps. If the user enters a physical address that can be found on Google Maps or Maps by Apple, Best Beans will most likely be able to accurately identify the center of the user’s farm. If the user’s farm does not have a complete physical address, they may enter the street name, city, state, and zip code closest to the farm to ensure better accuracy for Best Beans to center the farm on the map.

Farm Registration Android

Farm Registration iPhone
Quick Find Address:
– The “Quick Find Address” feature allows users to quickly identify their physical address with the click of a button. If the user is in the vicinity of the farm, they can press the “Use Current Location” button under the “Quick Find Address” option. The user will then be prompted with a message asking if the physical address given is correct. If it is correct, the user can press the “Yes” button on the message screen to auto-fill the form above. If it is incorrect, the user will need to manually provide the address in the form above.

Quick Find Address Android
Quick Find Address iPhone
Setting Farm Boundaries:
– Best Beans recommends that users draw boundaries around crop areas on their farm to ensure the accuracy of location when sampling methods are being undertaken for CBB and CLR control. Boundaries also help to prevent anomalies in data sets so that data will stay only on the user’s farm and will not interfere with data points outside of the boundaries.
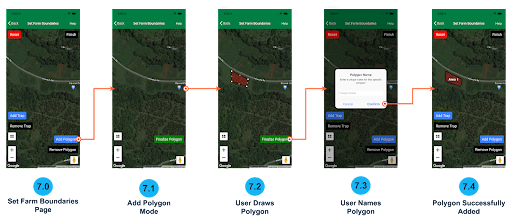
Add Polygons:
– In order to add polygons, users must do the following:
-
- Press the “Add Polygon” button in the lower right part of the screen. The add polygon mode should be activated when a single green button labeled “Finalize Polygon” appears and hides the other buttons.
- Users will tap around a crop area of their farm. The polygon is closed and complete when the shape is colored red.
- When the polygon is closed, the user can press the “Finalize Polygon” button to be prompted with a “Polygon Name” alert where the user can name the previously drawn polygon.
- After the user has entered the polygon name, they can press the “Confirm” button to complete the adding a polygon process.
- Repeat steps 1-4 until satisfied with the polygon coverage of the user’s farm.

Add Polygon Android

Add Polygon iPhone
Remove Polygons:
– In order to remove polygons, users must do the following:
-
- Press the “Remove Polygon” button in the lower right part of the screen.
- The user will be prompted to a list of existing polygons on the map with their names.
- Choose the desired polygon to be deleted.
- Press the “Remove” button once a polygon has been selected.

Remove Polygons Android


Remove Polygons iPhone
Adding and Removing Traps:
– In order to add a trap, users must do the following:
-
- Press the “Add Trap” button in the lower-left part of the screen.
- Tap an area of the farm where a trap would be placed on your farm.
- The user will be prompted to name the trap when the trap has been placed in a location.
- Press the “Confirm” button once that trap has been named.
– Removing traps has the same process as removing polygons mentioned above. To begin, users can press the ‘Remove Trap’ button on the lower left side of the app.

Adding Traps Android

Adding Traps iPhone
Complete Farm Setup:
– Once users have finished setting boundaries and traps on their farm, they can press the “Finish” button in the top right corner. Users will then be taken to the ‘Welcome’ page which means they have successfully completed the signup process, and are able to Log In to their account. Users can press the “Login” button on the welcome page to be directed back to the Login page.

Complete Farm Setup Android

Complete Farm Setup iPhone
2) Sampling and Monitoring:
Best Beans offers 3 ways to monitor users’ farms:
- Thirty Trees Sampling Method (CBB)
- Thirty Trees Sampling Method (CLR)
- Traps
Thirty Tree Sampling (CBB):
– The Thirty Trees Sampling Method will show you berry-infestation and bean damage levels, but more importantly, it will show whether the beetle is vulnerable to being killed by spray or not. This sampling method will also reveal hot spots on your farm and allow users to minimize costs by identifying the most effective times to spray Beauveria and which areas of the farm need attention.
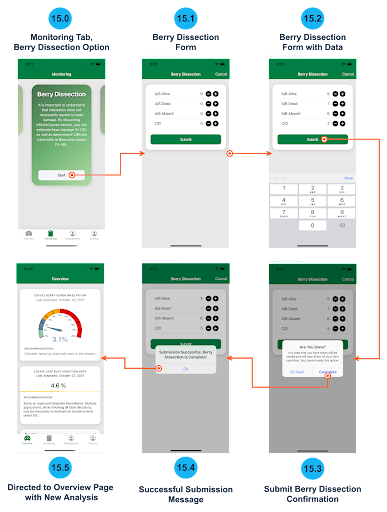
- Berry Dissections:
- During the thirty trees sampling method, it is recommended to take 3-4 CBB infested green berries for each counted branch to determine CBB positions in the berries. Users need to keep track of 4 scenarios when dissecting berries:
-
-
- A/B Alive
- A/B Dead
- A/B Absent
- C/D
-
-
- Berry Dissections provide a more detailed analysis of when a user should spray.
Monitoring for Incidence Rate:
– CLR Incidence (the percentage of diseased leaves per plot) can be used for monitoring and as an indicator for spraying. Monthly monitoring may be necessary to detect CLR at incidences under 5%. This 5% level is critical for sprays to be effective in managing CLR in Hawaii.
Traps:
– Traps will not control or eradicate CBB, but they can be used as an optional monitoring tool to determine when CBB populations may be increasing and to help indicate when to start sampling.
3) Execution of Sampling Methods:
Dual Monitoring:
– Dual Monitoring is a combination of the Thirty Tree Sampling Method for CBB and CLR. The sampling processes for both CBB and CLR are very similar and the dual monitoring function allows users to be able to do both at the same time. The following steps explain how to use the dual monitoring functionality:
- Begin sampling at tree #1 close to the corner of one of your polygons.
- Randomly select a lateral branch in the middle of the tree with 30-120 berries.
- Record/Enter the total number of green berries and infested green berries in the form under the correct fields.
- Press on the “Next Tree” button to submit data for the current tree being assessed.
- Switch to the CLR tab above to start assessing the same tree (or a nearby tree) for CLR incidence
- Look for CLR infected regions on the lower to mid part of the canopy and select one branch.
- Record/Enter the number of total leaves and total infected leaves on the selected branch in the form under the correct fields.
- Press on the “Next Tree” button to submit data for the current tree being assessed.
- Switch back to the CBB tab and move on to the next tree. Repeat steps 2 – 8 until at least 25 trees have been assessed.
- Tap on the “Submit Both” button on the bottom once completed. Users will be directed to the overview page with updated analysis on the previous sampling data set.

Getting Started with Dual Monitoring Android

Getting Started with Dual Monitoring iPhone


Finishing up Dual Monitoring Process Android
– Finishing up the Dual Monitoring Process:

Finishing Dual Monitoring iPhone
Removing and Editing Entries:
– In the event the user makes a mistake and wants to delete a previous entry, they can do the following:
-
- Scroll down below the form to view all previous entries listed for either CBB or CLR.
- Choose an entry to delete, and press the Trash Can icon next to the chosen entry.
- A confirmation to delete the entry will show up. Press on the “Confirm” button to proceed to delete. Otherwise, press “Cancel” to cancel the deletion process.
- Users will see an updated list with the deleted entry removed from the list.

Removing Entries Android


Removing Entries iPhone
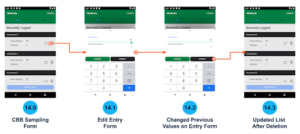
– In the event the user wants to make an edit to a previous entry, the user can do the following:
-
- Scroll down below the form to view all previous entries listed for either CBB or CLR.
- Choose an entry to edit, and press the Notepad icon next to the chosen entry.
- A form to edit the chosen entry will appear from the bottom.
- Change the values as desired
- Press on the ‘Submit’ button to confirm changes.
- Users will see the updated list with the newly edited entry.
Editing Entries Android


Editing Entries iPhone
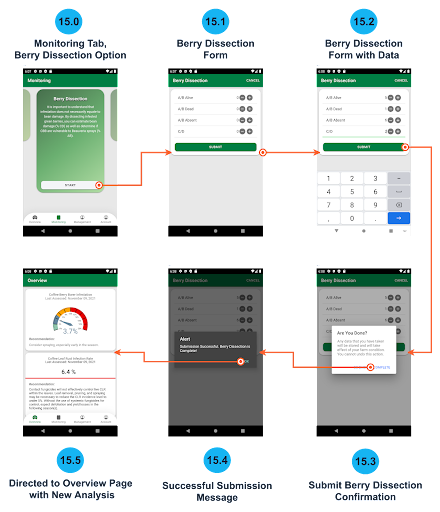
Berry Dissections:
– Using the berries collected from the trees sampling in the user’s previous tree sampling session, users should dissect these berries to look for CBB positioning within the berry. Use the berry dissection form to keep track of the 4 positions possible when looking for CBB in the dissected berries. Users can also use the tally system on the berry dissection form for an easier method of counting. Just press the ‘+’ icon to increment the count, and the ‘-’ icon to decrement the count if needed on the respective fields of positioning. Users can also enter the count using the number pad.
Berry Dissections Android
Berry Dissections iPhone
Trap Assessments:
– In order to assess a trap, users must do the following:
- On the map with trap locations, choose the desired trap to sample by pressing on it. This will open up a page with a picture of a sample collection of CBB in a container.
- Pour the contents of the sampled trap into a container that will allow you to easily compare with the pictures shown in the app.
- Compare your trap catch to the image shown on the app.
- Tap on the ‘ – ‘ button if your trap catch has less than the image.
- Tap on the ‘ + ‘ button if your trap catch has more than the image.
- Tap on the “Thumbs up” icon if your trap catch looks the same as the shown image.
- The process will finish if the “Thumbs up” icon is pressed, or when the algorithm does not have more pictures to compare to. This process usually takes on average 3-7 pictures to complete.

Trap Assessment Android


Trap Assessment iPhone
4) Managing Tasks:
– Best Beans offers easy tracking and logging for users when applying farm management tasks. This allows users to understand the relationship between their farm and CBB infestation / CLR Incidence Levels.
Adding a Management Task
– To add a management task, users can do the following:
- Navigate to the third tab on the bottom called ‘Monitoring’.
- In the top right corner, press the ‘Add Management” button. This will open up the form to add a management.
- Fill out required fields (Management Type, Weather (If Spray is Chosen), Date, Time, Notes).
- Management Type, Weather, Date, and Time all require users to fill out the form using the dropdown menu picker when users press on the option to be filled.
- Users should type in additional notes in the ‘Notes’ text box if needed.
- Press the submit button once the form is complete.
- The form will submit and close. The most recent management entry will be added to the very top of the ‘Most Recent’ List and is available in the Management sorted slides at the bottom of the Management page.

Adding a Management Task Android


Adding a Management Task iPhone
Management Interface:
– If the farm that the user is on has previously recorded management tasks on Best Beans, users will see that the Management Tab offers a ‘Most Recent’ at the top of the page, and boxes named after management types below.
Most Recent List:
– The ‘Most Recent’ list logs down the most previous management logs entered in Best Beans with the most previous at the top. This list only shows the last 10 entries made in Best Beans, revealing the Management Type, Date, and Notes for each entry.

Most Recent List Android

Most Recent List iPhone
Sorted Management Types:
– If users want to see logs sorted by the different management types, they can scroll through the management type boxes left to right under ‘View Logs’. Users can press these boxes to open up a log that only reveals management logs of the type that the box was named after.

Sorted Management Types iPhone

Sorted Management Types Android
5)Analysis Tools:
– Best Beans offers 5 analysis tools to help users understand infestation levels on their farm and CLR incidences:
- Overview Information
- Graphs
- Heatmaps
- Field Reports
Overview Page:
– The ‘Overview’ Page contains the infestation Gauge to display the most recent level of CBB infestation analyzed from the most recent tree sampling that took place on the user’s farm. Along with the number percentage of infestation, a recommendation for users to take action on their farm is displayed under the gauge.
– The CLR Incidence meter displays the most recent CLR incidence analyzed from the most recent CLR sampling that took place on the user’s farm. Along with the number and percentage of CLR incidence, a recommendation is shown below the meter for users to take action on their farms.

Overview Page Android

Overview Page iPhone
Graphs:
– Graphs are essential for users to understand trends over time on their farm. In our use case, we use two graphs. The Infestation Over Time Graph, and The Flight Activity Over Time Graph. To navigate to these features, users must be on the Overview tab and press the ‘Graphs’ button. Then they will be brought to a page to choose which graph to display.

Graphs Android

Graphs iPhone
Infestation Over time Graph:
– The Infestation Over Time graph shows infestation levels of CBB over time. Each data point is reflected by tree assessments that have been submitted for sampling.
Interacting with Data Points:
– Users can interact with the line graph by pressing a point on the line. It will reveal more accurate details about that point such as the Date and Infest Rate since the x-axis of the graph is not able to fit all of the dates of the data points.


Changing Dates:
– When users open up the Infestation over time Graph, the dates default with the end date set at the current date, and the start date set at the current date a year ago. This will only show data between the start and end dates on the graph. To change the dates, users can do the following:
-
-
- Press on the ‘Start Date’ field to change the date. A date picker will appear at the bottom of the application.
- Scroll through the date options to pick the desired date.
- Changing the ‘End Date’ field is similar to steps 1-2.
- Press the ‘Done’ button in the Date Picker to close the Datepicker after the desired date is chosen.
- Press on the ‘Update’ button to see updated results.

Changing Dates Android
-

Changing Dates iPhone
Flight Activity Over Time Graph:
– The Flight Activity Over Time graph shows a general trend of flight activity on your farm by recording data using traps. Usually, a dramatic increase in flight activity means that it is a good time to start spraying.
– When users open the Trap Catch Graph, the Total Trap Catch graph is the default graph and is shown first to the viewer. Users can switch to the Average Trap Catch Graph by switching tabs from ‘Total’ to ‘Average’. Users can also pinch and zoom to zoom into the data points.

Flight Activity Over Time Android

Flight Activity Over Time iPhone
Heatmaps:
– The Heatmap makes it easy for users to visualize data when doing tree sampling for CBB. This will help users understand the levels of infestation in areas of their farm so that they can easily focus on an area to apply CBB management solutions.
– By default, when heatmaps are opened, the heatmap for CBB data points during the current month and year will be presented first. If no data exists in the current month and year, users will receive a message alerting the user that no data exists. In the event data exists in a certain time frame, users will see a heatmap displayed on their farm from tree sampling execution in the month.
Changing Dates:
– To change dates, users can do the following:
-
- Press on the ‘Filter’ field to change the date. A date picker will appear at the bottom of the application.
- Scroll through the date options to pick the desired date.
- Press the ‘Done’ button in the Date Picker to close the Datepicker after the desired date is chosen.
- Press on the ‘Update’ button to see updated results.

Changing Dates Android

Changing Dates iPhone
Switching to CLR Heatpoints:
– Users can switch to view CLR heatpoints by pressing on the CLR Tab in the toolbar. Functionality to change dates is similar to changing dates with the CBB Heatmap.

Switching to CLR Heatpoints Android

Switching to CLR Heatpoints iPhone
Field Reports:
– Field Report Overview:

Field Reports Overview Android

Field Reports Overview iPhone
– Field Reports provide a history to all tree assessments and trap assessments done on the farm.
To get to the field reports, users can do the following:
- On the Overview page, press on the ‘Field Reports’ button
- The default report that will be shown first is the most recent report from Tree Sampling for CBB.
- Users can traverse through reports using the ‘Previous’ and ‘Next’ buttons on the bottom of the page
- To quickly find a report, users can use the calendar to find a report. By clicking on the calendar icon in the top right of the toolbar, a calendar will open up with field reports marked as brown circles on the days they were created.
- Use the arrows on the calendar to navigate through the calendar to find the desired report.
- Press on a marked date to see the field report of the date chosen.

Field Reports Android

Field Reports iPhone
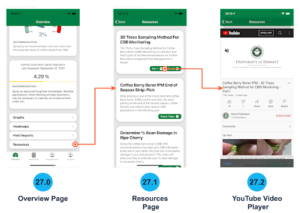
6) Resources:
– Multiple resources are provided for users to read and watch to learn more about CBB and CLR management. The resources are provided to the user via .pdf, or by video on YouTube.

Resources Overview Android
Resources Overview iPhone
– To view resources, users can do the following:
- On the Overview page, press the ‘Resources’ button.
- A list of available resources is shown to the user. Press on the green buttons to open resources (Video or PDF document) in their respective box with the resource title and description.

Resources Overview Android

Resources Overview iPhone